Skip to main content
Our School
Welcome
Calendar
Calendar
P.E. Days and Kit
Term Dates
The School Day & Yr 6 SAT Dates
Our Vision
Governors
Insignis Sport Partnership
Insignis Activity Week
Insignis Varsity Games
Youth Sport Trust Annual Awards - Winners 2025
Meet Our Team
Senior Leadership Team
Teachers
Teaching Assistants
Office Team
News
Letters
Nursery
Reception
Key Stage 1
Year 3 and 4
Years 5 and 6
Parent Post
Trips, Residentials and Experiences
Ofsted
Parent View
Our History
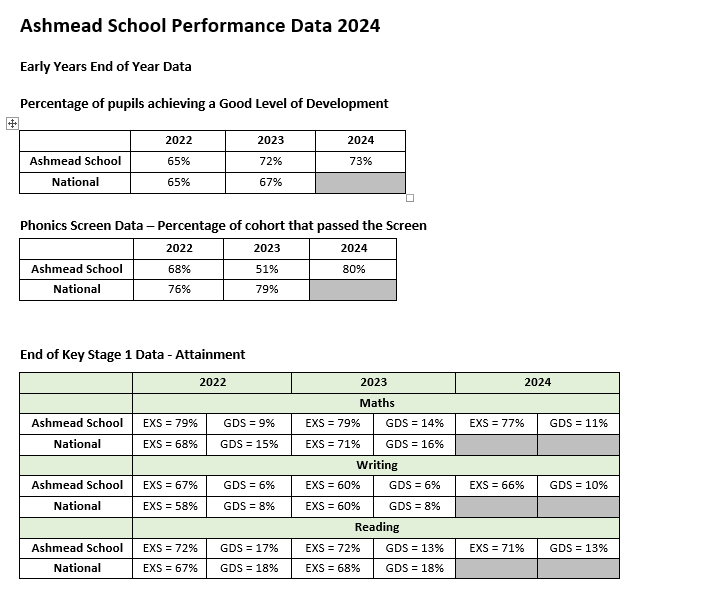
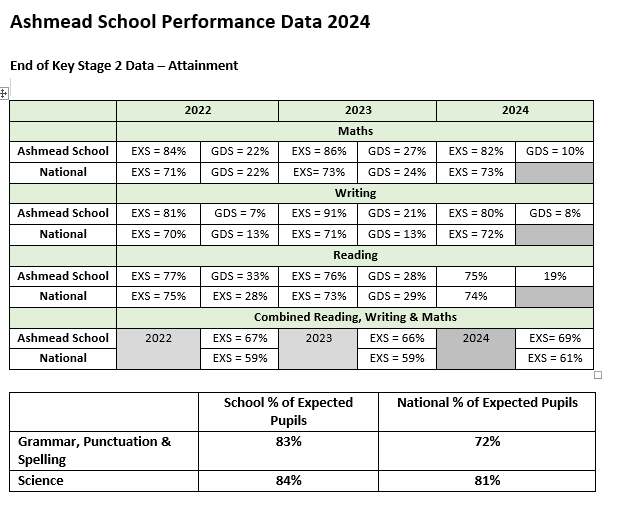
Performance Data
Policies
Well Being across the trust
Curriculum
Galleries
British Values
Cultural Capital
Curriculum
Curriculum Thematic Overviews
Art
Computing
Design & Technology
Geography
History
Languages
Maths
Music
Oracy
Phonics
Physical Education
PSHE and RSE
Reading
Religious Education
Science
Writing
Home Learning
Pupil Assessment
Safeguarding
External Support
Mental Health
Children's Mental Health Week 2025
Online Safety
Pastoral Provisions
Safeguarding
Safeguarding Policies & Guidance
Staying Safe
Parents
11+ Secondary Transfer Test
Attendance
Parent and Community Links
Parent Teacher Association (PTA)
Pebble Brook Community Café
Pupil Premium
School Clubs
SEND
Wrap Around Care
Pupils
Ashmead Befrienders & Peer Mentors
Celebrating Us
ECO Schools
Health & Wellbeing
Outdoor Explorers
School Council
School Meals
School Uniform
Joining Ashmead
Admissions
New Starters - Reception
School Prospectus
Tours of the School
Vacancies
Future Recruitment Events
SCITT - with Teach First
Train to Teach with Insignis Academy Trust
Vacancies
Working with other Teacher Training Providers in Buckinghamshire
Virtual School Tour
Contact Us
Accessibility Statement
Contact Us
Ashmead School
Search Site
Translate Page
Twitter
Instagram
Facebook
Parent Mail
Our School
Welcome
Calendar
Calendar
P.E. Days and Kit
Term Dates
The School Day & Yr 6 SAT Dates
Our Vision
Governors
Insignis Sport Partnership
Insignis Activity Week
Insignis Varsity Games
Youth Sport Trust Annual Awards - Winners 2025
Meet Our Team
Senior Leadership Team
Teachers
Teaching Assistants
Office Team
News
Letters
Nursery
Reception
Key Stage 1
Year 3 and 4
Years 5 and 6
Parent Post
Trips, Residentials and Experiences
Ofsted
Parent View
Our History
Performance Data
Policies
Well Being across the trust
Performance Data
↑
Search site

 Search Site
 Translate Page
 Twitter
 Instagram
 Facebook
 Parent Mail